
What Equipment Is Used For Concrete Scanning Services and How Does It Work?
CNI Locates utilizes nondestructive high frequency ground penetrating radar antennas with a range of 1500 MHz – 2600 MHz to perform concrete imaging and scanning services. These antennas are typically used to locate rebar, post tension, conduits, metallic objects, non-metallic objects, voids, etc. in and under concrete. CNI Locates also performs concrete slab scanning, concrete imaging, condition assessments, and structural inspections with these antennas for apartments & condominiums, builders, bridges, commercial companies, contractors, factories, high rise buildings, homeowners, medical buildings, military facilities, municipal buildings, new construction projects, ports, renovations, restaurants, retail stores, roads & highways, warehouses, etc. Before someone anchors, core drills, cuts, drills, excavates, jack hammers, saw cuts, etc. it is highly recommended to have those areas scanned with concrete scanning antennas or GPR, so they can protect the integrity of a structure by avoiding any important features or utilities in or under the concrete while performing work. CNI Locates GPR antennas don’t produce any harmful radiation or by-products, which makes GPR safe to use for technicians and individuals surrounding the work area.
What Is GPR?
Ground Penetrating Radar (GPR) works by sending a small pulse of energy into a material and recording the strength and the time required for the return of any reflected signal. A series of pulses over a single area make up what is referred to as a scan. Reflections are produced whenever the energy pulse enters a material with dissimilar electrical conduction properties or dielectric permittivity from the material it left. The strength, or amplitude, of the reflection is determined by the contrast in the dielectric constants and conductivities of the two materials.
While some of the GPR energy pulse is reflected to the antenna, energy also keeps traveling through the material until it either diminishes (attenuates) or the GPR control unit has closed its time window. The rate of signal attenuation varies widely and is dependent on the properties of the material through which the pulse is passing.
Materials with a high dielectric will slow the radar wave and it won’t be able to penetrate as far. Materials with high conductivity will attenuate the signal rapidly. Water saturation dramatically raises the dielectric of a material, making an area difficult to scan due to signal attenuation.
Metals are a complete reflector and don’t allow any amount of signal to pass through them. Materials beneath a metal sheet, fine metal mesh, pan decking, or any other metallic objects will not be visible.
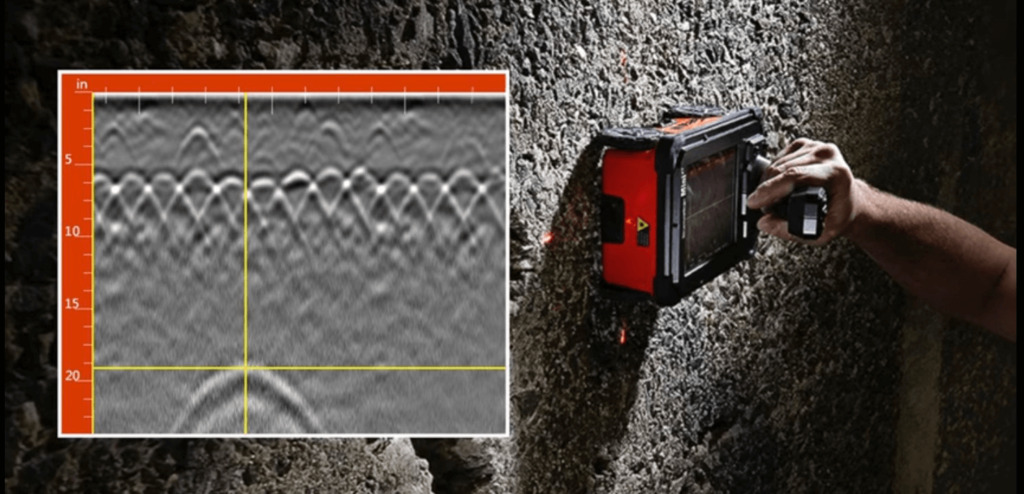
Radar energy is not emitted from the antenna in a straight line. It is emitted in a cone shape. The two-way travel time for energy at the leading edge of the cone is longer than for the energy directly beneath the antenna. This is because that leading edge of the cone represents the hypotenuse of a right triangle.
Since it takes longer for that energy to be received, it is recorded farther down in the profile. As the antenna is moved over a target, the distance between the two decreases until the antenna is over the target and increases as the antenna is moved away. For this reason, a single target will appear in the data as a hyperbola. The target is at the peak amplitude of the positive wavelet.
Difference Between X-Ray and Concrete Scanning
Ground Penetrating Radar is typically the best choice for concrete scanning and imaging due to its ability not to produce harmful radiation or by-products, accuracy, cost effectiveness, efficiency, and speed. X-Ray imaging requires access to both sides of the concrete making it difficult or impossible to utilize in many scenarios. The use of X-Ray imaging also emits harmful radiation to technicians and those in the area and special precautions must be taken to ensure safety of personnel around the site. For this reason, X-Ray work is generally performed after hours, adding to the overall cost of the service. The X-Ray process is slower than GPR concrete scanning, and typically images must be developed off-site as opposed to the immediate results from GPR concrete scanning. X-Ray images may also be inadvertently flipped by the technician interpreting the results, leading to an incorrect analysis or damages in the work area.
Ground penetrating radar has fewer limitations than X-Ray imaging and the quality of the results is typically more than sufficient for most applications. The use of X-Ray may be advisable when GPR scanning is unable to pick up necessary detail, or in circumstances where tight tolerances call for absolute precision. Ground penetrating radar is considered the go-to technology for concrete scanning and imaging, though an accurate interpretation of the results is dependent upon properly trained technicians.
Advantages of Using Ground Penetrating Radar for Concrete Scanning
Ground penetrating radar concrete scanning antennas are often the first choice when scanning or imaging the concrete, and for a good reason. It’s an extremely effective method for determining what lies inside and underneath concrete structures and the approximate depths of those features. Ground penetrating radar is a non-destructive device and emits no harmful radiation or by-products. It can be used to quickly scan large areas with no additional set-up time necessary. Typically, access is only needed on one side of a slab or structure, and the radar can generally penetrate depths of 18” – 24”. GPR concrete scanning is also significantly lower in cost than other methods such as X-Ray imaging.
Advantages of Using X-Ray for Concrete Imaging
While concrete X-Ray imaging is an older form of technology, it’s extremely effective at providing clear imaging in work areas that have tight tolerances or defects. X-Ray is generally considered more precise than GPR scanning since there is less room for interpretation of the results. X-Ray imaging can show more detail about the condition or size of embedded objects such as rebar. Sometimes it’s even possible to show areas of corrosion or other defects.
Take Advantage of Our Expert Technicians and Services!
C-N-I Locates LTD offers a wide range of services to ensure your safety, the safety of others, and the property the work is being performed at. With us, you can get Aerial Drone Imagery, Design Survey Locating, Electrical Fault Detection, Ground Penetrating Radar, Leak Detection, Magnetic Detection, Metallic Line Detection, Non-Metallic Line Detection, Plastic Water Pipe Detection, Public and Private Utility Locates, Sewer Crawler Inspections, Structural & Concrete Imaging, Utility Mapping, Video Push Camera Inspections, and more from experienced technicians in all of Oregon and Washington State. We have field offices in Eugene, Oregon, Portland, Oregon, Everett, Washington, Renton, Washington, Seattle, Washington, and Tacoma, Washington. To learn more about our wide range of services we can offer you, visit our website and request an estimate or schedule a work order today! You can also call (877) 826-1177 or email [email protected] with any questions or to schedule a service within 24 hours’ notice Monday – Friday.
Below is an Attenuation, Conductivity, and Dielectric Constant Reference Chart for Materials with GPR
| GPR Velocity Table and Analysis of Velocity, Dielectric Constants, Attenuation, and Conductivity Values for Materials From Various Sources (Multiple entries reflect different references. Values are obtained from internet sites and other sources open to the public. This chart does not validate if the GPR velocity, dielectric constants, attenuation, or conductivity values are good representations of the material described.) | |||||
| MATERIAL | DIELECTRIC CONSTANT K | CONDUCTIVITY (mS/m) | GPR VELOCITY (m/ns) | GPR VELOCITY (ft/ns) | ATTENUATION (dB/m) |
| Air | 1 | 0 | 0.3 | 0.98 | |
| Air | 0.31 | 1.00 | |||
| Air | 1 | 0 | 0.3 | 0.98 | |
| Air | 1 | 0 | 0.3 | 0.98 | 0 |
| Air | 1 | 0 | 0.3 | 0.98 | 0 |
| Air | 1 | 0 | |||
| Asphalt | 3 to 5 | 0.173 to 0.134 | 0.57 to 0.44 | ||
| Asphalt | 0.14 | 0.44 | |||
| Asphalt (dry) | 3 | .001 to .01 | |||
| Asphalt (wet) | 9 | .01 to .1 | |||
| Basalt (Wet) | 0.11 | 0.33 | |||
| Bauxite (Dry) | 0.06 | 0.20 | |||
| Clay (Dry) | 0.15 | 0.50 | |||
| Clay (saturated freshwater) | 8 to 12 | .09 to 0.11 | 0.28 to 0.35 | ||
| Clay (wet) | 8 to 12 | 100 to 1000 | 0.106 to 0.087 | 0.35 to 0.29 | |
| Clay (Wet) | 0.06 | 0.19 | |||
| Clay (wet) | 10 | 100 to 1000 | |||
| Clayey Soil (dry) | 2.4 | 0.27 | |||
| Clayey Soil (wet) | 15 | 50 | |||
| Clays | 5 to 40 | 2 to 1000 | 0.06 | 0.2 | 1 to 300 |
| Clays | 5 to 40 | 2 to 1000 | 0.06 | 0.2 | 1 to 300 |
| Coal | 4 to 5 | 0.15 to 0.134 | 0.49 to 0.44 | ||
| Coal | 0.14 | 0.50 | |||
| Concrete | 5 to 10 | 0.134 to 0.095 | 0.44 to 0.31 | ||
| Concrete (Dry) | 0.13 | 0.44 | |||
| Concrete (dry) | 7 | .001 to .01 | |||
| Concrete (Wet) | 0.09 | 0.29 | |||
| Concrete (wet) | 15 | 0.01 to 0.1 | |||
| Dolomite | 6 to 8 | 0.122 to 0.106 | 0.40 to 0.35 | ||
| Dry Salt | 0.13 | 0.40 | |||
| Dry Salt | 5 to 6 | 0.01 to 1 | 0.13 | 0.43 | |
| Dry Salt | 5 to 6 | 0.01 to 1 | 0.13 | 0.43 | .01 to 1 |
| Dry, sandy, flat coastal land | 10 | 2 | 0.095 | 0.31 | |
| Dry, sandy, flat coastal land | 10 | 0.09 | 0.31 | ||
| Granite | 4 to 6 | 0.01 to 1 | 0.13 | 0.43 | 0.01 to 1 |
| Granite | 4 to 6 | 0.01 to 1 | 0.13 | 0.43 | 0.01 to 1 |
| Granite (dry) | 5 | 0.00001 | 0.134 | 0.44 | |
| Granite (Dry) | 0.14 | 0.44 | |||
| Granite (Wet) | 0.12 | 0.40 | |||
| Granite (wet) | 7 | 1 | |||
| Ice | 0.15 | 0.50 | |||
| Ice | 3 to 4 | 0.01 | 0.16 | 0.52 | |
| Ice | 3 to 4 | 0.01 | 0.16 | 0.52 | 0.01 |
| Ice | 4 | 1 | |||
| Ice Fresh Water | 4 | 0.1 to 10 | 0.15 | 0.49 | |
| Limestone | 4 to 8 | 0.5 to 2 | 0.12 | 0.39 | 0.4 to 1 |
| Limestone | 4 to 8 | 0.5 to 2 | 0.12 | 0.39 | 0.4 to 1 |
| Limestone (dry) | 7 to 9 | 0.000001 | 0.113 to 0.1 | 0.37 to .33 | |
| Limestone (Dry) | 0.13 | 0.44 | |||
| Limestone (dry) | 7 | 0.11 | 0.37 | ||
| Limestone (Wet) | 0.11 | 0.36 | |||
| Limestone (wet) | 8 | 25 | |||
| Loamy Soil (dry) | 2.5 | 0.11 | |||
| Loamy Soil (wet) | 19 | 21 | |||
| Loamy/Clayey Soils (Dry) | 0.19 | 0.67 | |||
| Mineral/Sandy Soils (Dry) | 0.13 | 0.40 | |||
| Mixed soil components saturated | 5 to 15 | 0.08 to 0.13 | 0.25 to 0.44 | ||
| Organic Soils | 0.04 | 0.13 | |||
| Peats | 0.04 | 0.13 | |||
| Permafrost | 4 to 8 | 0.01 to 10 | 0.15 to 0.106 | 0.49 to 0.35 | |
| Permafrost | 6 | 0.01 to 10 | |||
| Permafrost Frozen Soil | 0.13 | 0.40 | |||
| Potash Ore | 0.13 | 0.44 | |||
| PVC, Epoxy, Polyesters, vinyl’s, rubber | 3 | 0.173 | 0.57 | ||
| Quartz | 4 | 0.15 | 0.49 | ||
| Rock (dry) | 5 | 0.00001 | |||
| Sand & Gravel (Dry) | 0.13 | 0.44 | |||
| Sand & Gravel Frozen | 0.14 | 0.44 | |||
| Sand (dry) | 4 to 6 | 0.0001 to 1 | 0.15 to 0.12 | 0.49 to 0.39 | |
| Sand (Dry) | 0.15 | 0.50 | |||
| Sand (Dry) | 3 to 5 | 0.01 | 0.15 | 0.49 | 0.01 |
| Sand (Dry) | 3 to 5 | 0.01 | 0.15 | 0.49 | 0.01 |
| Sand (dry) | 4.5 | 0.0001 to 1 | |||
| Sand (dry) | 4 to 6 | 0.12 to 0.15 | 0.40 to 0.49 | ||
| Sand (dry) Quartz | 1.8 to 6 | 0.12 to 0.22 | 0.40 to 0.73 | ||
| Sand (saturated freshwater) | 30 | 0.05 | 0.18 | ||
| Sand (wet) | 25 | 0.1 to 1 | 0.055 | 0.18 | |
| Sand (Wet) | 0.08 | 0.27 | |||
| Sand (Wet) | 20 to 30 | 0.1 to 1.0 | 0.06 | 0.2 | 0.03 to 0.3 |
| Sand (wet) | 25 | 0.1 to 10 | |||
| Sand (wet) Quartz, and kaolinite, illite and smectite clays, saturated freshwater | 9 to 67 | 0.04 to 0.10 | 0.12 to 0.33 | ||
| Sand and mixed soil components, dry | 2 to 6 | 0.12 to 0.21 | 0.40 to 0.69 | ||
| Sand Saturated | 0.06 | 0.20 | |||
| Sand Saturated | 20 to 30 | 0.1 to 1.0 | 0.06 | 0.2 | 0.03 to 0.3 |
| Sandstone (Wet) | 0.13 | 0.40 | |||
| Sandstone (wet) | 6 | 40 | |||
| Sandy Soil (dry) | 2.6 | 0.14 | |||
| Sandy Soil (wet) | 25 | 6.9 | |||
| Sandy Soils (Wet) | 0.06 | 0.21 | |||
| Sea Ice | 4 to 12 | 0.15 to 0.087 | 0.49 to 0.29 | ||
| Sea Water | 70 | 400 | 0.033 | 0.11 | |
| Sea Water | 80 | 3000 | 0.01 | 0.03 | 1000 |
| Sea Water | 80 | 3000 | 0.01 | 0.03 | 1000 |
| Sea Water | 81 | 4000 | |||
| Sea Water | 81 | 0.03 | 0.11 | ||
| Shale | 5 to 15 | 1 to 100 | 0.09 | 0.3 | 1 to 100 |
| Shale (wet) | 7 | 100 | |||
| Shales | 5 to 15 | 1 to 100 | 0.09 | 0.3 | 1 to 100 |
| Silt (saturated) | 10 | 0.09 | 0.31 | ||
| Silt (wet) | 10 | 1 to 10 | 0.095 | 0.31 | |
| Silt (wet) | 10 | 1 to 100 | |||
| Silts | 5 to 30 | 1 to 100 | 0.07 | 0.23 | 1 to 100 |
| Silts | 5 to 30 | 1 to 100 | 0.07 | 0.23 | 1 to 100 |
| Snow | 0.25 | 0.80 | |||
| Snow | 1.4 | 0.001 to 0.01 | |||
| Syenite Porphyry | 0.13 | 0.40 | |||
| Tills | 0.09 | 0.31 | |||
| Travertine | 0.11 | 0.36 | |||
| Volcanic Ash | 0.09 | 0.29 | |||
| Water | 0.03 | 0.11 | |||
| Water Distilled | 80 | 0.01 | 0.033 | 0.11 | 0.002 |
| Water Distilled | 80 | 0.01 | 0.033 | 0.11 | 0.002 |
| Water Fresh | 81 | 0.10 to 30 | 0.033 | 0.11 | |
| Water Fresh | 81 | 0.03 | 0.11 | ||
| Water Fresh | 80 | 0.5 | 0.033 | 0.11 | 0.1 |
| Water Fresh | 80 | 0.5 | 0.033 | 0.11 | 0.1 |
| Water Fresh | 80 | 0.5 | |||